Coalition Impact Calculator: Economic Impact Web Tool
Overview
A national, federally funded nonprofit runs an alliance of two dozen local economic-development coalitions. Each coalition is staffed by community practitioners, not economists, yet each is expected to put a credible economic-impact number in front of funders and boards. The result is predictable: a confident but indefensible figure that collapses under a reviewer’s first question, and two dozen incompatible numbers that cannot be added into one program-level total.
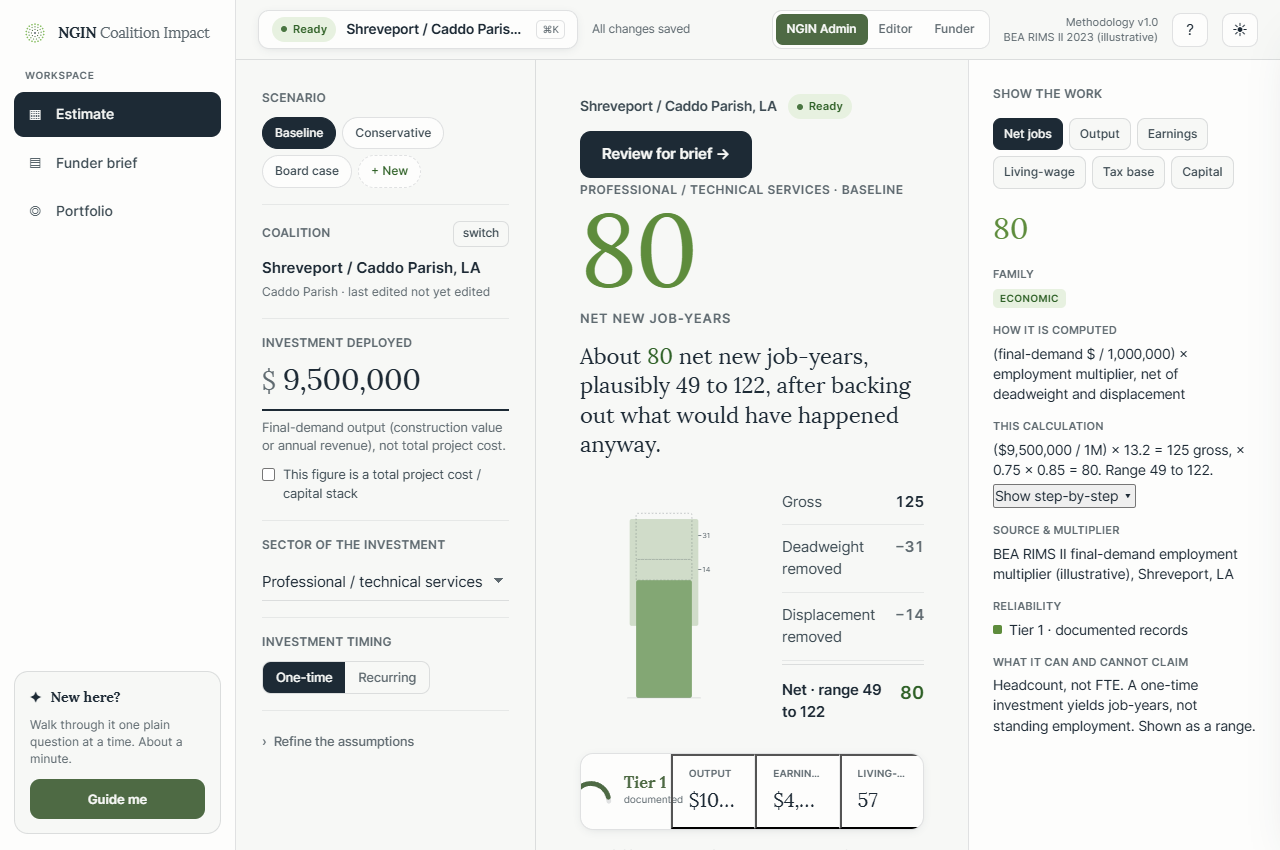
We built a working, brand-styled, single-file calculator and dashboard that demonstrates the full experience end to end. A guided flow walks a non-specialist from the numbers they actually hold toward the correct net-new inputs, with inline guardrails that flag a wrong dollar base at entry. A gross-to-net waterfall shows the headline number going down (minus deadweight, minus displacement, equals net), pre-answering the first funder challenge. Every figure carries a reliability tier and a clickable drawer tracing it to a named public source and the operative multiplier.
A one-click, print-ready Impact Brief pairs the case for investment with honest caveats and an auto-generated source appendix, generated client-side with no server. The prototype shows how a documented quantitative method becomes a rigorous, accessible, funder-ready product.
The brief we set for the prototype: make a funder-defensible impact estimate producible by a non-economist, and make it look and feel like a finished product rather than a spreadsheet.
- Non-specialists entering the wrong dollar base and publishing a confident, indefensible number
- Two dozen coalitions computing with their own assumptions, producing numbers that cannot be compared or summed
- A skeptical funder audience that asks, on sight, gross or net, what displacement, and where is that multiplier
- A need for the tool to be accessible, embeddable, and free of hosting overhead
We delivered a single, dependency-free interactive tool built as one shared data model with many views.
- A guided estimate flow that moves a non-specialist toward correct net-new inputs, with guardrails at entry
- A gross-to-net counterfactual waterfall that shows the number come down, with a one-line reason at each step
- Reliability-tier provenance that traces every figure to a named public source (BEA RIMS II, BLS, Census, and more)
- A one-click, print-ready funder brief with honest caveats and an auto-generated source appendix, generated client-side
- A portfolio rollup that standardizes site numbers into one comparable, double-count-protected program total
- Accessibility to WCAG 2.2 AA: keyboard operable, screen-reader labeled, with a data-table fallback behind every chart
- A portable, CMS-embeddable build with shareable, URL-encoded state and no backend
See the Design in Action
Explore the full design concept and see how we approached solving the challenges outlined above.
View ConceptReady to Build Something Great?
Let's discuss your project and see how we can help your organization achieve its goals.
Start a Project